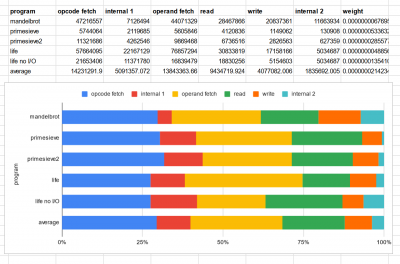
A few months ago I had a hypothesis about what types of bus cycles the CPU would perform most often, e.g. opcode fetch, operand fetch, or general data reading and writing. I think I guessed that it would be about 50% opcode fetches, 25% operands, 20% random access data, and 5% I/O operations. I'd been meaning to test that on some "real world" programs, so I wrote some - a Mandelbrot plotter, a prime sieve, another prime sieve, and a Life simulation - and analysed them.
Hoglet's decoder can output a profiling summary of code that has executed, including how many times each instruction was executed and what the total cycle count was for that instruction. I used that to deduce what kinds of bus cycles were executed - the cycle count for example can inform how often branches are taken, or how often page crossing penalties are paid. This could be done better inside the decoder code, as it already knows most of this, but I did it as a postprocess. Here are the results: (Edit: replaced with corrected version, the "average" calculation was wrong)
Attachment:
 cycletypefrequencies.png [ 92.81 KiB | Viewed 30053 times ]
I included a second copy of the data from the Life simulation with a serial output busy-waiting loop edited out, because that loop was dominating the profile otherwise. It's not an invalid data point, just a bit of an outlier perhaps, or a rather different kind of workload.
The "average" row aggregates all of them, weighted by their inverse execution time ("weight" column).
I separated "internal" cycles, i.e. ones where the CPU doesn't care about the bus, into "internal 1" - being ones that read from program memory, e.g. the next opcode - and "internal 2" where the CPU is executing a dummy read somewhere else, e.g. the stack, or rereading an address in the middle of a read-modify-write. "internal 1" often happens after an opcode fetch when there's no operand - but not always, sometimes it happens after the operand fetch.
I think the results are interesting. My 50% guess was intended to include most of "internal 1" as opcode fetches - but I still overestimated that by quite a bit. Operand fetches are more common than I'd guessed, as are general purpose reads and writes. I didn't separate out I/O accesses because it wasn't easy to do so from the data I had, and I think that's highly dependent on the type of program.
The mandelbrot program is very light on "internal 1" - I think because a lot of the work it's doing is arithmetic with values stored in memory, so it doesn't have many implied instructions. It is correspondingly heavier on "internal 2" because it does a lot of read-modify-write operations to memory (particularly shifts and rotates).
The prime sieves don't have much "internal 2" - perhaps because they don't do those kind of read-modify-write operations. They are completely different programs, but have very similar distributions here.
I had wondered whether it was theoretically possible to shorten the CPU clock during internal cycles, as the limiting factors in my system seem to be the address bus transition time and subsequent decoding etc - but it's probably not worth it given they are relatively rare.
Writes are on the whole quite rare though, so if it was possible to shorten the clock in general but add a wait state for writes, that could be a win.
For reference - the profile data for each is also included in its repository:


