I've continued working on a way to generate the "big picture" of what's happening. As an example, here is the screen after a couple of seconds of execution:
Attachment:
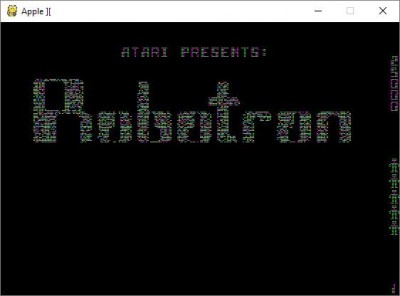 intro.jpg [ 20.89 KiB | Viewed 1495 times ]
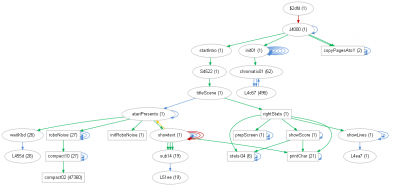
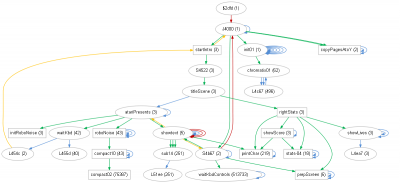
This is the corresonding auto-generated call-tree.
Attachment:
 call_tree.dot1.png [ 78.67 KiB | Viewed 1495 times ]
- JSR = green
- JMP = red
- branchings (if taken) = blue
- RTS if not paired with JSR
The paired RTS are not shown, if they did they would return to the sources of the green arrows. The
showgext sub displays "Atari presents" at the top of the screen. The string is supplied as param immediately after the JSR to
showtext, therefore the RTS does not match that JSR and is shown in yellow.
The nodes are "stretches" of code which the automatic analysis shows to be related. For the nodes with a box shape the analysis determines that it is a regular subroutine. Arrows shown are between stretches, not between the actually leaping instruction (which is somewhere in a stretch) and the target it leaps to (which is in the same or a another stretch). This pruning of the call tree is important, especially for bigger trees, because with otherwise the huge number of arrows and nodes gets confusing and unwieldly. As a side effect, complex stretches with many branches catch the eye (
init01,
showtext with JMP-loops inside the stretch).
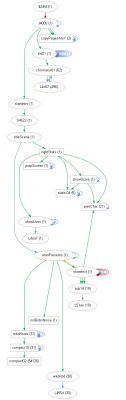
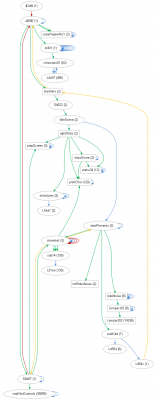
The call tree gives a good impression of the overall structure and gives hints on the execution flow. For small call trees that's fine, but for the bigger ones I am currently trying to understand it is difficult to discern what comes first. I've therefore added the following alternative view:
Attachment:
 call_tree.dot2.png [ 89.99 KiB | Viewed 1495 times ]
Here the nodes are ordered vertically by the cycle count of the first execution of that particular stretch. (The nodes are randomly ordered in horizontal direction, to fill the available space as best as possible). You can follow the
init01 doing its work in the beginning, then the intro starts with the title scene which contains a part which shows the stats on the right side of the screen, then the "Atari presents" and then the noisily dotted "Robotron" animation.
printChar is used twice: first to show the score, later to show the "Atari presents". A node is located where its stretch executed for the first time, so there is an upward JSR arrow from
showtext to
printChar. Showing nodes only once is another type of pruning which has turned out really helpful for bigger trees.
The second alternative also shows major loops. If I press space then the intro screen changes to the control selection:
Attachment:
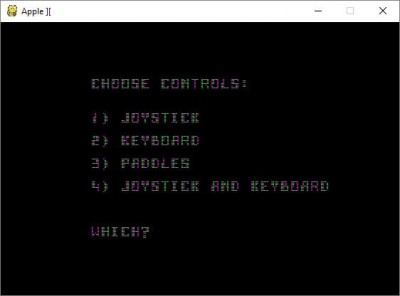 control.jpg [ 15.36 KiB | Viewed 1495 times ]
If I press escape then the intro starts over with the "Atari presents" and the "Robotron" visualisation. The corresponding call trees:
Attachment:
 call_tree.dot3.png [ 100.1 KiB | Viewed 1495 times ]
The call tree shows the return to the intro sequence, but using the cycle-timed layout the flow of execution becomes more evident, with the yellow RTS jumps showing how the code is stitched together:
Attachment:
 call_tree.dot4.png [ 122.27 KiB | Viewed 1495 times ]
Together with the load/save snapshot feature of the workbench this has really given my understanding a good push forward. But it's of course just the superficial picture of the executing code. More insight will have to come from not only seeing the flow but also understanding which stretches read and manipulate memory. I haven't started with this topic yet, though.


